
Whether you are someone who just cannot make a decision on everyday occurrences, or you are a business owner who wants to improve both your own and other people’s from your organization’s decision-making, this article is written for you!

We have all experienced lack of self-confidence when we need to choose what we should do in a specific situation or time. This directly affects the psychological and professional parts of our lives.
Some people have an innate ability to make a fast and good decision no matter if it’s which shoes should they buy or which investment should they make next. Those people don’t have issues with this problem, but those who do can implement the well-known Pareto chart in their life!
Before we go into details, make sure you also learn more project management secrets – learn about project charters and get a project charter template.
What is a Pareto chart?
A Pareto Chart is a graph that highlights the frequency of problems and defects as well as their overall effect. These charts are immensely useful for identifying and prioritizing problems to get the biggest overall improvement. It is one of the most effective problem-solving tools available to any business mostly due to its simplicity and easiness of reading.

Pareto chart is named after Italian economist and sociologist Wilfredo Pareto who conducted a study in Europe about economical and social conditions at the start of the 20th century. He came to an assumption that everything in the world is presented in a distribution of 80/20 where 80 represents a significant few and 20 extremely minor of everything.
The whole thing about the Pareto chart is that everyone can visually by simple charts present the problems divided by their significance. Furthermore, thus presented, the diagram can emphasize which problems are the most significant ones so an individual or an organization can focus its efforts on that specific problem.
This principle is way more efficient since you focus just on the crucial obstacles rather than those small ones. As a result, observing problems like this, your efficiency will utterly improve.
What does a Pareto chart look like?
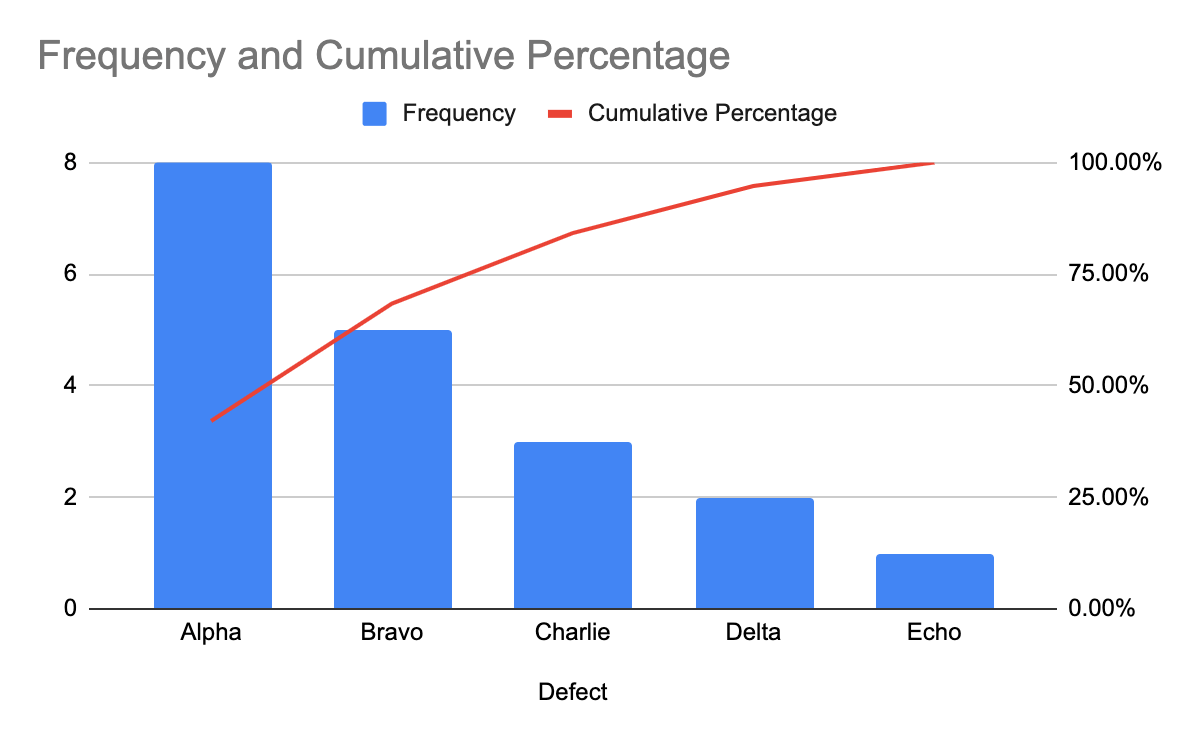
A visual example of a Pareto chart
A Pareto chart is a mixture of both bars and a line chart. As shown in the picture above, each bar represents the frequency of a single problem, while the line represents the cumulative percentage of those problems – it represents the percentage of how many problems would be solved if the highest defects were treated and eliminated.
Usually, the problems are sorted from the highest to the lowest bar. Sorting like this can give you an instant insight into what exact problem occurs the most and on which you should have the most focus.
Businesses use Pareto charts a lot because it gives them easier visual help in the evaluation and prioritization of resolving problems, especially in examining the frequency of problems in a process.
An 80/20 rule
Also known as the Pareto principle states that approximately 80% of the effects are triggered by 20% of the problems. Further explained, most effects are caused by a minority of problems.

That is why the visual presentation of a Pareto chart is a great way to identify those minorities with the greatest impact in order to eliminate those effects they cause. The majority are also called trivial many, and the minority vital few.
This principle is often applied in business since it can help you identify which areas of your work are the most significant ones so you can focus your time and efforts on them to get things done effectively.
Final words
Unlike in its early days, a Pareto chart is now used in all fields of industry, from economics to engineering to manufacturing! Its implementation can considerably help identify and resolve the most serious issues in a business. It not only provides a terrific visual insight into problems, but it also allows you to realize where the potential lies and what the organization could do better.